



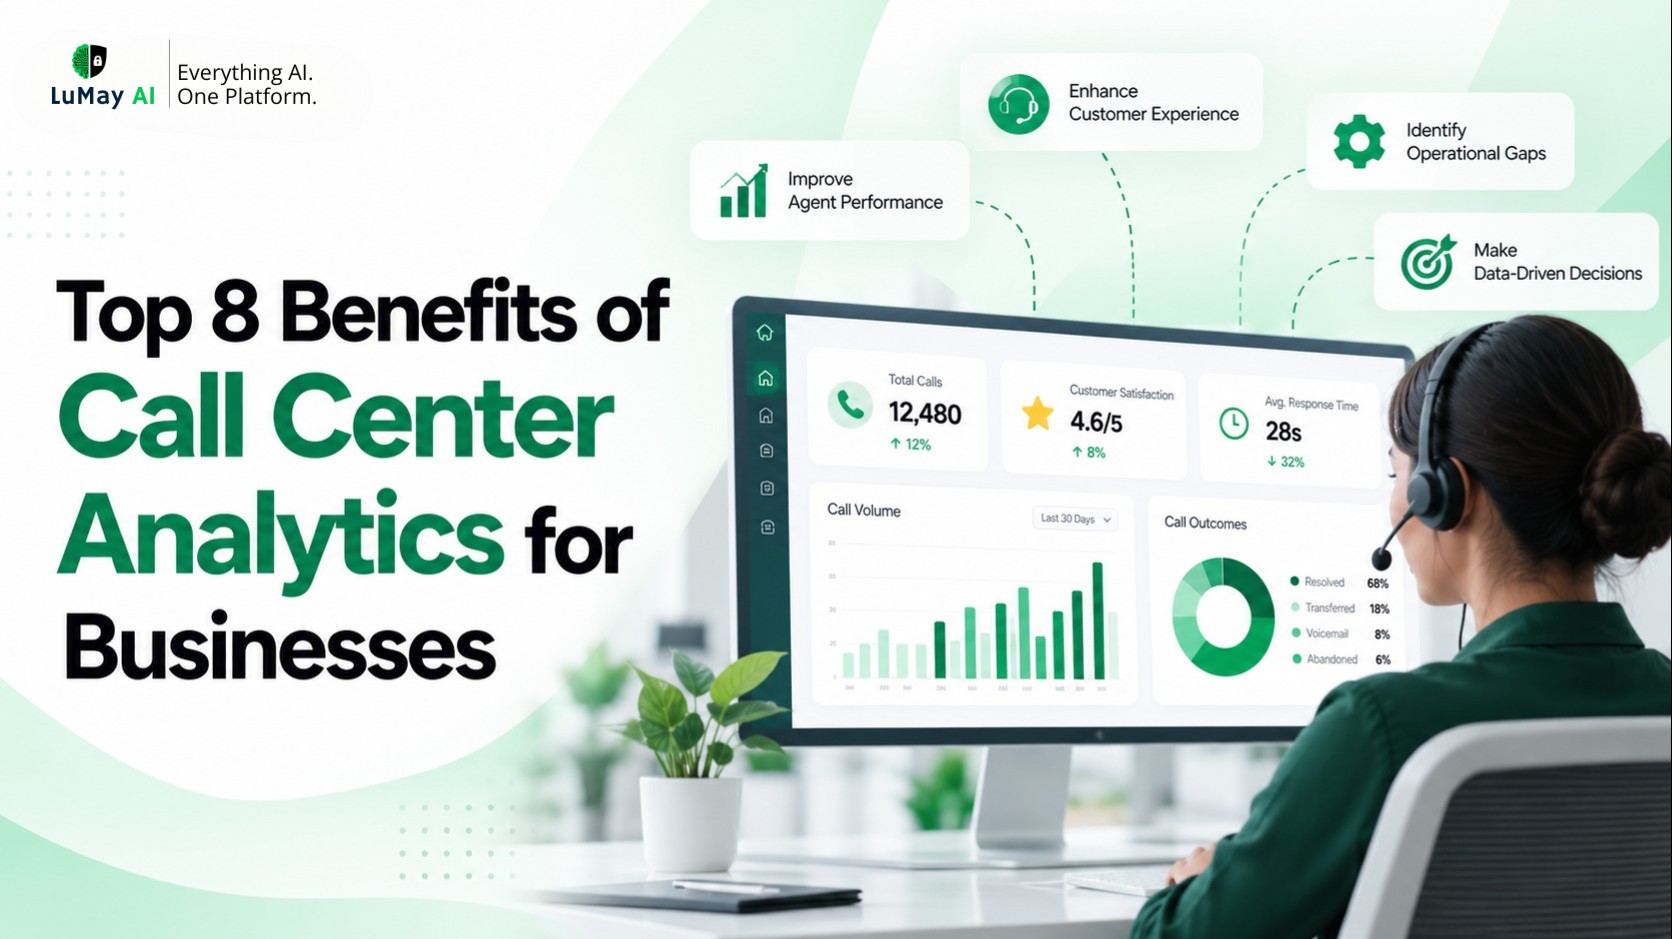
Why call center analytics matters
Most call centers already collect more data than they use. Every call leaves a trail: queue time, handle time, transfers, a recording, and the reason the customer called in the first place. Call center analytics is how you turn that trail into decisions.
If you're researching the topic, you probably want to know what it actually does for a business, which metrics matter, and where AI fits. This guide covers the eight benefits that show up most often, the call center metrics behind each one, and how to start without buying tools you don't need.
Key takeaways
Call center analytics combines operational data (queues, handle times, transfers) with conversation data (what callers said and how they felt).
The biggest wins usually come from understanding call drivers, not from shaving seconds off handle time.
First call resolution is one of the most useful single metrics, because repeat calls cost money and patience.
AI now makes it practical to analyze every call, including topics and sentiment, instead of a small sample.
The same data that sharpens your reporting also shows which calls are ready for automation.
What is call center analytics?
Call center analytics is the practice of collecting, measuring, and interpreting data from customer calls to improve performance and guide business decisions. It draws on two kinds of data.
Operational data describes how calls move: volume by hour, speed of answer, abandonment, handle time, and transfers. This has been the backbone of call center reporting for decades.
Conversation data describes what happens inside the call: the reason for calling, the words used, customer sentiment, and the outcome. Transcription and speech analytics made this layer practical at scale.
You'll also hear "contact center analytics," which applies the same ideas across chat, email, and messaging. The strongest programs combine both kinds of data, because a long handle time means little until you know what the caller needed.
How call center analytics works
Most programs follow the same five steps, whatever the software.
Capture. Data comes from the phone system (ACD and IVR logs), call recordings, CRM or helpdesk records, and post-call surveys.
Transcribe and tag. Recordings become text, and each call is labeled with a reason, an outcome, and often a sentiment score.
Aggregate. Dashboards roll the data up by hour, queue, team, and call reason so trends become visible.
Analyze. Teams move from descriptive questions (what happened?) to diagnostic ones (why?) and, with enough history, predictive ones (what will next Monday look like?).
Act and measure. Someone changes staffing, a process, a script, or a self-service flow, and the same metrics show whether it worked.
Step five is where many programs stall. Reporting that never changes a decision is just decoration.
Top 8 benefits of call center analytics
The examples below are illustrative, but each reflects a pattern that shows up often once teams start measuring.
1. You learn why customers are really calling
The problem: volume climbs, and nobody can say which issues are driving it.
What analytics reveals: call driver analysis groups calls by reason and time, exposing patterns no single agent would notice.
Metrics: volume by call reason, volume by hour, repeat call rate.
What to do: fix the upstream cause, publish clearer information, or give that call type a faster path.
Impact: fewer avoidable calls, and more agent time for work that needs a person.
Example: an online retailer sees order-status calls spike every Monday. A Sunday evening shipping text removes much of that spike before it reaches the queue.
2. First call resolution improves
The problem: customers call back about the same issue, which doubles the cost of solving it.
What analytics reveals: linking calls by customer and reason shows which issues need a second or third call, and where the process breaks.
Metrics: first call resolution (FCR), repeat call rate, transfer rate.
What to do: give agents the missing access, change the policy that forces a callback, or clarify the step that confuses customers.
Impact: SQM Group's FCR research links each 1% improvement in FCR with a 1% reduction in operating costs.
Example: an insurer finds claim-status calls rarely resolve first time because agents can't see adjuster notes. Granting read access removes a whole category of repeat calls.
3. Staffing matches real demand
The problem: queues overflow at some hours while agents sit idle at others.
What analytics reveals: interval-level reporting shows exactly when demand peaks and how quickly callers give up.
Metrics: volume per 30-minute interval, average speed of answer, abandonment rate, service level, occupancy.
What to do: shift schedules, stagger breaks, and forecast from history instead of gut feel.
Impact: shorter waits without extra headcount, and less burnout from constant overload.
Example: a utility sees abandonment surge between 8 and 9 a.m. Moving three start times earlier costs nothing and flattens the peak.
4. Cost per call comes down
The problem: leadership sees rising spend but not what's behind it.
What analytics reveals: cost by call reason and handling path shows which call types are expensive, and why: long holds, multiple transfers, or repeat contacts.
Metrics: cost per call, average handle time by reason, transfer rate.
What to do: target the most expensive call types first, rather than pressuring every agent to talk faster.
Impact: savings that don't degrade service. Labor is the lever that matters; Gartner notes it can represent up to 95% of contact center costs.
Example: a software company finds billing calls transferred twice cost far more than those solved by the first agent. Training one tier on billing fixes most of it.
5. You catch sentiment shifts early
The problem: dissatisfaction surfaces only after customers cancel or post reviews.
What analytics reveals: customer sentiment analysis scores calls for frustration and tracks the trend by reason, product, or week.
Metrics: sentiment trend, share of negative calls, supervisor requests, CSAT.
What to do: investigate any call reason whose sentiment drops, and alert the team that owns it.
Impact: problems get fixed while they are still small.
Example: after a price change, a subscription business sees negative sentiment on billing calls rise within days, long before churn data would show it.
6. Broken routing and processes get fixed
The problem: callers bounce between departments or loop through the IVR.
What analytics reveals: path analysis shows where calls transfer, where they abandon inside the menu, and which queues receive calls they can't resolve.
Metrics: transfer rate, IVR abandonment, misroute rate, time to reach an agent.
What to do: rewrite menu options, adjust routing rules, or merge queues.
Impact: less wasted time for callers and agents, and cleaner data downstream.
Example: a clinic learns that many "billing" calls are really appointment questions because the menu wording is vague. One rewritten prompt fixes the routing.
7. You find revenue you were missing
The problem: sales and booking calls go unanswered or unconverted, and nobody measures the loss.
What analytics reveals: call analytics ties outcomes to revenue: missed calls after hours, bookings per call, and which call types convert.
Metrics: missed call rate, after-hours volume, booking or conversion rate, callback time.
What to do: add after-hours coverage, speed up callbacks, and focus effort on the highest-converting call types.
Impact: demand that was already calling you gets captured.
Example: a dental group finds a steady stream of evening calls going to voicemail, mostly new patients. Covering those hours becomes a revenue decision, not a cost debate.
8. The whole business gets better information
The problem: product, marketing, and leadership teams decide without hearing customers directly.
What analytics reveals: call center reporting that summarizes top issues and trends turns the call center into a listening post.
Metrics: top call reasons by product, week-over-week trend changes, sentiment by feature or policy.
What to do: send a short monthly insight report to issue owners and track whether fixes land.
Impact: fewer recurring problems, and a call center seen as a source of insight rather than only a cost.
Example: a telecom's reports show setup calls spiking for one router model, prompting the product team to rewrite the quick-start guide.
Call center metrics worth tracking
These are the call center metrics most teams rely on. Track them by call reason, not only in aggregate, or the averages will hide the story.
Metric | What it tells you | Typical calculation |
|---|---|---|
First call resolution (FCR) | Whether issues get solved without a callback | Calls resolved on first contact ÷ total calls |
Average handle time (AHT) | Time spent per call, including hold and wrap-up | (Talk + hold + after-call work) ÷ calls handled |
Average speed of answer (ASA) | How long callers wait for a person | Total wait time ÷ answered calls |
Abandonment rate | How many callers give up before reaching someone | Abandoned calls ÷ offered calls |
Service level | Share of calls answered within your target time | Calls answered within X seconds ÷ calls offered |
Transfer rate | Routing or skill gaps | Transferred calls ÷ calls handled |
Repeat call rate | Issues that didn't stay solved | Repeat callers on the same issue within a set window ÷ callers |
Customer satisfaction (CSAT) | How callers rate the experience | Positive survey responses ÷ total responses |
Containment rate | Calls fully resolved by self-service or AI | Calls resolved without an agent ÷ calls entering automation |
Cost per call | Efficiency of the whole operation | Total contact center cost ÷ calls handled |
How AI is changing call center analytics
For years, most teams reviewed a small sample of recorded calls by hand. AI changes the math: with automatic transcription and language models, every call can be analyzed.
Three shifts stand out. The first is topic discovery. Tools such as Google's Conversational Insights build a taxonomy of call drivers from the conversations themselves, rather than relying on agents to pick a disposition code in a hurry. The second is sentiment and moment detection, which flags frustration, supervisor requests, or long holds across all calls. The third is speed: dashboards update as calls happen, so supervisors can act the same day.
AI voice agents add another layer. When an AI agent handles the call, the conversation is already transcribed, summarized, and tagged. LuMay's voice agent, for instance, produces a transcript and structured summary for every call and surfaces volume, resolution rates, escalation triggers, common intents, and sentiment trends in a live dashboard (full feature list).
One caveat: automated tags still need checking. Review a sample each week until you trust the labels.
How analytics identifies opportunities for call automation
Once you have clean call driver data, automation candidates are easy to spot. Look for calls that are high in volume, repetitive in structure, and dependent on a lookup or a simple action: order status, booking and rescheduling, balance checks, opening hours, password resets.
Then run each candidate through three questions. Does the answer live in a system you can connect to? Is the outcome clear enough to measure? Would most callers be comfortable completing it with an AI agent?
Partial automation counts too. Gartner points out that using AI to capture a caller's name, account details, and reason for calling could cut up to a third of the interaction time a human agent would otherwise spend.
After launch, analytics keeps doing its job: containment rate, transfer reasons, and sentiment show whether automation is resolving calls or just deflecting them. For common patterns, see these types of intelligent call automation and how an AI inbound voice agent handles bookings and lookups before passing complex calls to your team with full context.
Practical steps for getting started
Pick two or three business questions, such as "why are repeat calls rising?" A dashboard with 40 metrics is not a starting point.
Audit your data. Check what your phone system, CRM, and recordings already capture, and whether call reasons are logged consistently.
Standardize call reasons. A short, clean list beats dozens of overlapping disposition codes.
Set baselines for FCR, abandonment, handle time, and volume by reason before you change anything.
Change one thing at a time and measure it against the baseline.
Share results outside the call center so the fixes happen upstream, where most call drivers start.
Turn your call data into your next move
If your analytics already point to a handful of repetitive call types, the next question is how they would run with an AI agent, and what the reporting looks like afterward. LuMay Voice Agent handles those calls and logs every one with a transcript, outcome, and sentiment. Book a voice agent demo and bring one real call reason; the team will walk through the call flow, the handoff to your staff, and the dashboard your managers would use.


